 Contact Us
Custom dashboards for project tracking
When it comes to developing interactive dashboards, we specialize in customizing the dashboards as per your needs. We follow a series of steps to formulate the solution as per your requirement. Project progress can be tracked effectively with Plan in reference.
Storyboarding
All the components of the dashboard are finalized in this section. The user flow is defined and data collection sources are finalized.
Mockup
The layout of the dashboard is designed and client's feedback is taken before proceeding further. If there is a drilldown, the levels of the drilldown are defined, with appropriate filters.
Development
The dashboard is developed by our team and feedback from clients help our team in revisions and iterations. The dashboard is deployed after final approval.
Documentation
Documentation helps users to understand the whole process of Data collection and how they can take maximum leverage out of the dashboard to track the progress.
Ideation
We try to understand the pain-points of the clients, try to understand their vision with the solution and fix the KPIs that will be used to monitor. The platform for developing the dashboards is also decided in this phase.
BIM enabled Dashboards
We excel in developing advanced BIM-based BI Dashboards that empower you to seamlessly plan,
monitor, and make well-informed, critical decisions throughout your projects.
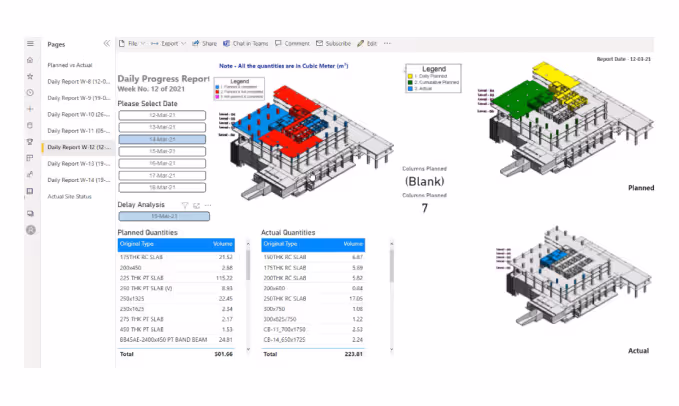
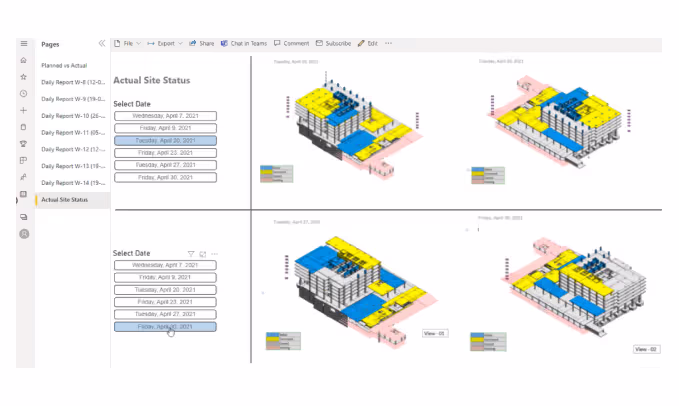
Project Monitoring Dashboards
We specialize in creating highly detailed and fully customized BIM-based BI Dashboards for comprehensive project monitoring. Our interactive visualizations and real-time data insights empower you to make informed decisions swiftly and confidently. Optimize your project management, streamline workflows, and achieve successful outcomes with our tailored dashboards.
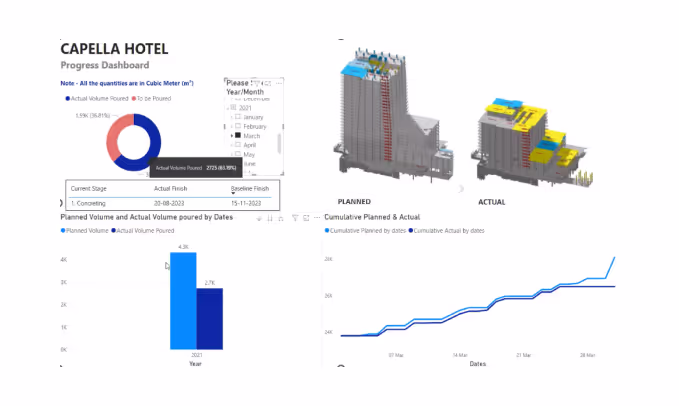
4D Dashboards
At Teksys, we seamlessly integrate BIM data into Power BI dashboards for real-time project schedule monitoring. Our custom visuals and data-driven insights empower proactive decisions and optimize resource allocation, streamlining collaboration for project success. With BIM and Power BI synergy, track milestones and ensure timely delivery.
5D Dashboards
We also excel in extracting quantities from BIM models and linking them to Power BI dashboards, facilitating in-depth cost analysis. By integrating quantity data into our dashboards, you gain valuable insights into material requirements, resource utilization, and associated costs throughout the project lifecycle.
With a focus on cost analysis, our dashboards provide a clear visualization of project expenses, allowing you to identify cost trends, potential cost overruns, and areas for cost optimization.
Why you should incorporate Business Intelligence and Data Analytics in your organization?
Data-driven decision making
The levels of Drilldown, advanced filters, and powerful graphs and charts derived from the data fed to the dashboard help users visualize the problems which giving an insightful experience. Clients can take effective business decisions using the platfrom with a lot more ease when compared to the traditional decision making techniques.
Big-data analytics
Large-scale Dynamic Construction projects have a tendency to generate large volume of data sets which could be extremely difficult to analyze. We offer services to solve this issue of our clients. Hidden patterns, correlations, predictive models for KPIs, market trends and customer preferences can be evaluated using these parameters. We help our clients to achieve the same.
Real-time progress tracking
With IoT devices and Integration with tools and applications used within an organization, progress can be stored in the database on real-time basis, which gets reflected in the dashboard. This enables users to track the progress, get productivity insights and set targets for future work.
Dynamic updates
With data getting captured on real-time basis, the dashboard becomes highly dynamic in nature, enabling users to get updates almost instantly, helping them gather insights without physically visiting the construction sites.
Generate insightful reports
Using dynamic dashboards help you generate customized reports as per your requirement which can be shared with other stakeholders effectively saving a lot of time and effort.
Reinforced with technological support
Our technology support team is available all time to resolve all your queries and issues. One-to-one interactions with our clients help us add value to their work.
Platforms used to create dashboards
We typically use the most widely used tools to deliver Business Intelligence and Data Analytics solutions.

Power BI

Looker Studio
Our Clients
Frequently Asked Questions
What are construction analytics solutions?
Construction analytics solutions utilize strategies, technologies, and tools for data collection and analysis, aiding effective decision-making. Teksys offers tailored dashboards for project tracking, integrating data from various sources to provide actionable insights for improved project management and productivity.
What are custom dashboards for project tracking?
Custom dashboards for project tracking are meticulously developed by Teksys, following a storyboard, mockup, and development process. These dashboards enable effective project progress monitoring with detailed visualizations and real-time data insights, empowering informed decision-making for successful project outcomes.
What benefits do BIM-enabled dashboards offer?
BIM-enabled dashboards offer benefits like seamless planning, monitoring, and well-informed decision-making throughout projects. Teksys specializes in creating highly detailed and customized BIM-based dashboards, optimizing project management, streamlining workflows, and ensuring successful outcomes with interactive visualizations and real-time data insights.
What do 4D and 5D dashboards do?
4D and 5D dashboards integrate BIM data into Power BI dashboards for real-time project schedule monitoring and cost analysis, respectively. Teksys's custom visuals and data-driven insights empower proactive decisions, optimize resource allocation, and provide clear visualization of project expenses, ensuring timely delivery and financial efficiency.
How do dashboards aid in decision-making?
Dashboards aid decision-making by providing insightful experiences through drilldown levels, advanced filters, and powerful graphs derived from data. Teksys's dashboards enable data-driven decision-making with ease, allowing clients to visualize problems, evaluate trends, and make effective business decisions swiftly.
Can dashboards handle big data in large projects?
Dashboards handle big data in large projects by offering services to analyze large volumes of data sets generated by dynamic construction projects. Teksys helps clients evaluate hidden patterns, correlations, and predictive models for KPIs, enabling effective decision-making and achieving business goals efficiently.
How is real-time project tracking done?
Real-time project tracking is achieved by integrating IoT devices and tools used within an organization to capture progress data in real-time. This data is stored in a database and reflected in dynamic dashboards, enabling users to monitor progress, gain productivity insights, and set targets for future work without physically visiting construction sites.

Concept to Creation with Tech-Driven Project Management
Reach out to us to know how we can help your team utilize the latest technologies in construction and achieve faster and better results.